4.2 Category 2 Variable 2: Percentage of White population
4.2.1 Map of percentage of white population in the United States
## create color palette used by map
pal <- colorBin("BuPu", metadataGIS$perc_white, n=9, reverse= TRUE)

leaflet(metadataGIS, options = leafletOptions(crsClass = "L.CRS.EPSG3857"), width="100%") %>%
  addPolygons(weight = 0.5, color = "gray", opacity = 0.7,
    fillColor = ~pal(perc_white), fillOpacity = 1, smoothFactor = 0.5,
    label = popupPlus("White Population", metadataGIS$perc_white, "percentage"),
    labelOptions = labelOptions(direction = "auto")) %>%
    addPolygons(data = stateGIS,fill = FALSE,color="black",weight = 1) %>%
    addLegend(pal = pal,values = ~metadataGIS$perc_white, opacity = 1, title = "% White",position = "bottomright")
4.2.2 Scatter plot of Vote for GOP(%) over percentage of white population
ggplot(metadata) +
  geom_histogram(aes(perc_white, ..count../50), alpha = 0.2, color = "#33A02B", fill ="#B2DF8A")+
  geom_point(aes(perc_white, pctGOP*100), color = "#666666", alpha = 0.2) +
  geom_smooth(aes(perc_white, pctGOP*100, color = "Local Polynomial Regression", fill = "Local Polynomial Regression"), method = "loess") +
  geom_smooth(aes(perc_white, pctGOP*100, color = "Linear Regression", fill = "Linear Regression"), method = "lm") +
  labs(title="Regression line percentage of white population on percentage vote for GOP", x= "White Population(%)", y= "Vote for GOP(%)", caption = "Histogram of the variable at the bottom, not scaled to the y axis.")+
  scale_colour_manual(name="Model Fit", values=c("blue", "red"))+
  scale_fill_manual(name="Model Fit", values=c("#A6CEE3", "#F89F9E"))+
  theme_bw() +
  theme(legend.position = "bottom")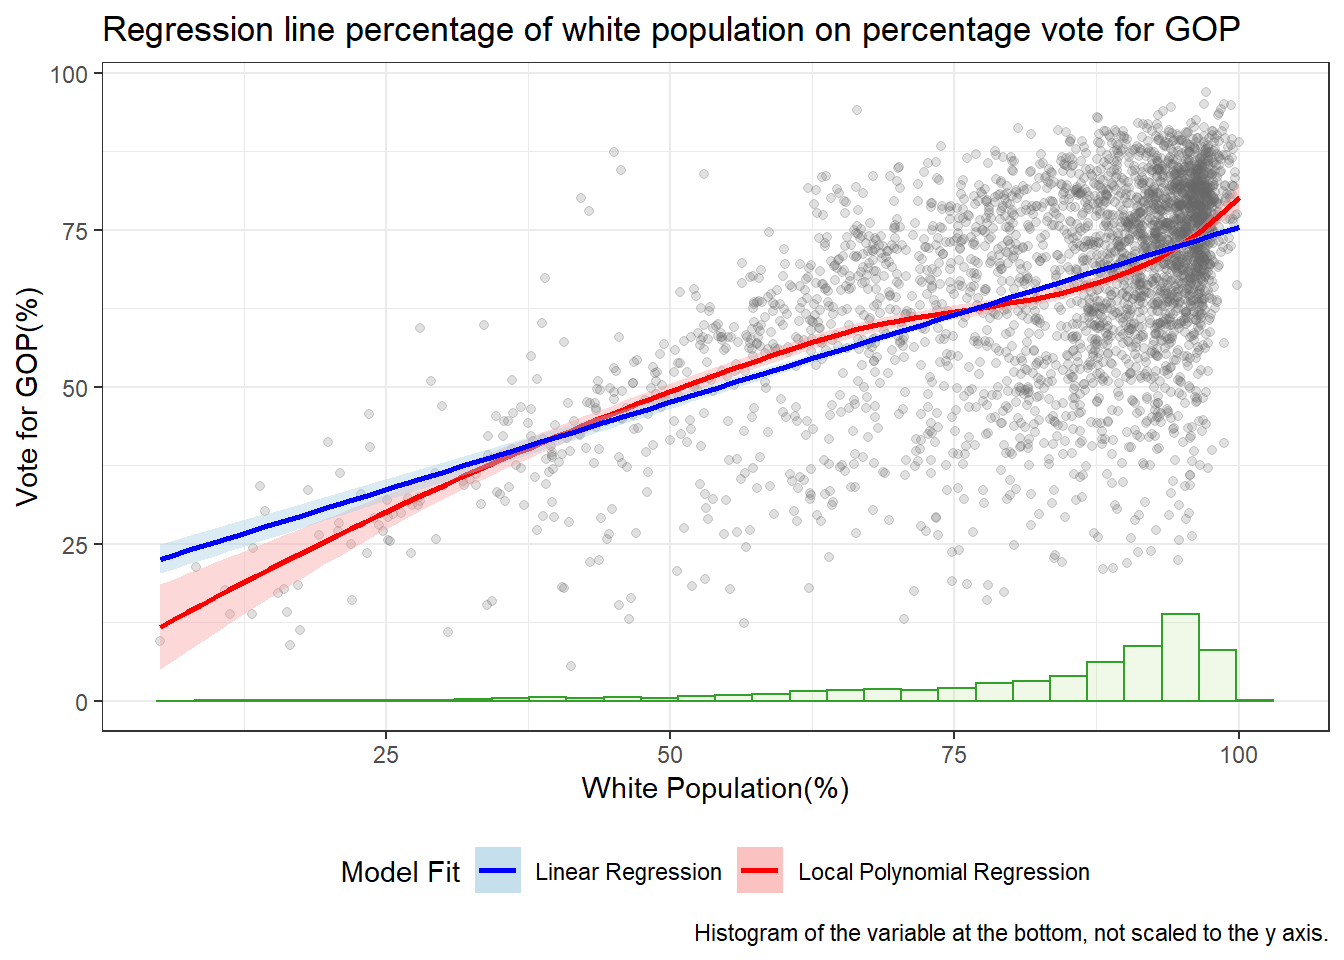
4.2.3 Summary statistics for regression of Vote for GOP(%) over percentage of white population
model2.2 <- lm(pctGOP~perc_white,data=metadata)
stargazer(model2.2,
type = "html",
report=('vc*p'),
keep.stat = c("n","rsq","adj.rsq"),
notes = "<em>*p<0.1;**p<0.05;***p<0.01</em>",
notes.append = FALSE)| Dependent variable: | |
| pctGOP | |
| perc_white | 0.006*** |
| p = 0.000 | |
| Constant | 0.197*** |
| p = 0.000 | |
| Observations | 3,108 |
| R2 | 0.316 |
| Adjusted R2 | 0.316 |
| Note: | *p<0.1;**p<0.05;***p<0.01 |